
GBP/USD Price Forecast: Bearish Pressure Builds as Daily Resistance Rejection Keeps Sellers in Control
Explore the latest GBP/USD technical analysis as bearish pressure builds beneath a key daily resistance trendline. Discover the current market bias, important support and resistance levels, and what traders should watch for in the coming sessions.
Highlighted Trade Setup Summary
GBP/USD Technical Analysis and Forecast
The British Pound continues to trade under pressure against the US Dollar as sellers defend a key resistance trendline visible on the daily timeframe. While the market remains above an important support zone around 1.3310, recent price action suggests that bullish momentum is weakening and that sellers may be preparing for another push lower.
In this multi-timeframe analysis, we will examine the daily, 4-hour, and 1-hour charts to identify the current market structure, directional bias, and the key levels traders should monitor in the coming sessions.
Daily Timeframe Analysis: Resistance Rejection Signals Seller Strength
The daily chart remains the most important timeframe in this analysis because it provides the broader market context. One of the most notable structures currently developing is a descending triangle pattern.
A descending triangle is generally considered a bearish continuation pattern. It forms when price continues to create lower highs while repeatedly finding support at the same level. This pattern often indicates that sellers are gradually gaining control while buyers struggle to generate enough momentum to push prices higher.
The descending resistance trendline continues to act as a major barrier for GBP/USD. Every attempt by buyers to push above this trendline has been met with selling pressure.
What makes this resistance level particularly important is the reaction from the previous daily candle.
During yesterday's trading session, buyers initially showed strength and attempted to extend the recovery. However, as price approached the descending trendline resistance, buying momentum faded and sellers stepped into the market aggressively. This resulted in a clear rejection from resistance, indicating that market participants were not willing to sustain higher prices.
Rejections are extremely valuable in technical analysis because they reveal the battle between buyers and sellers. In this case, the rejection tells us that sellers successfully defended a critical resistance area and prevented buyers from taking control of the market.
Today's candle is currently forming as a doji, which reflects indecision between buyers and sellers. While a doji often signals uncertainty, it does not automatically invalidate the bearish outlook. Instead, it suggests that the market is pausing after yesterday's rejection while participants decide on the next directional move.
As long as the descending triangle structure remains intact, the bearish correction remains active.
Why the Daily Rejection Matters
Many traders underestimate the significance of rejection candles, especially when they appear at key technical levels.
- Buyers attempted to move price higher.
- Sellers absorbed the buying pressure.
- The market was unable to sustain higher prices.
When this occurs on a higher timeframe such as the daily chart, the signal carries more weight because institutional traders and larger market participants often focus on these levels.
The recent rejection therefore increases the probability of continued downside pressure if support eventually fails.
4-Hour Timeframe Analysis: Compression Continues Near Support
The 4-hour chart provides a clearer view of the ongoing battle between buyers and sellers.
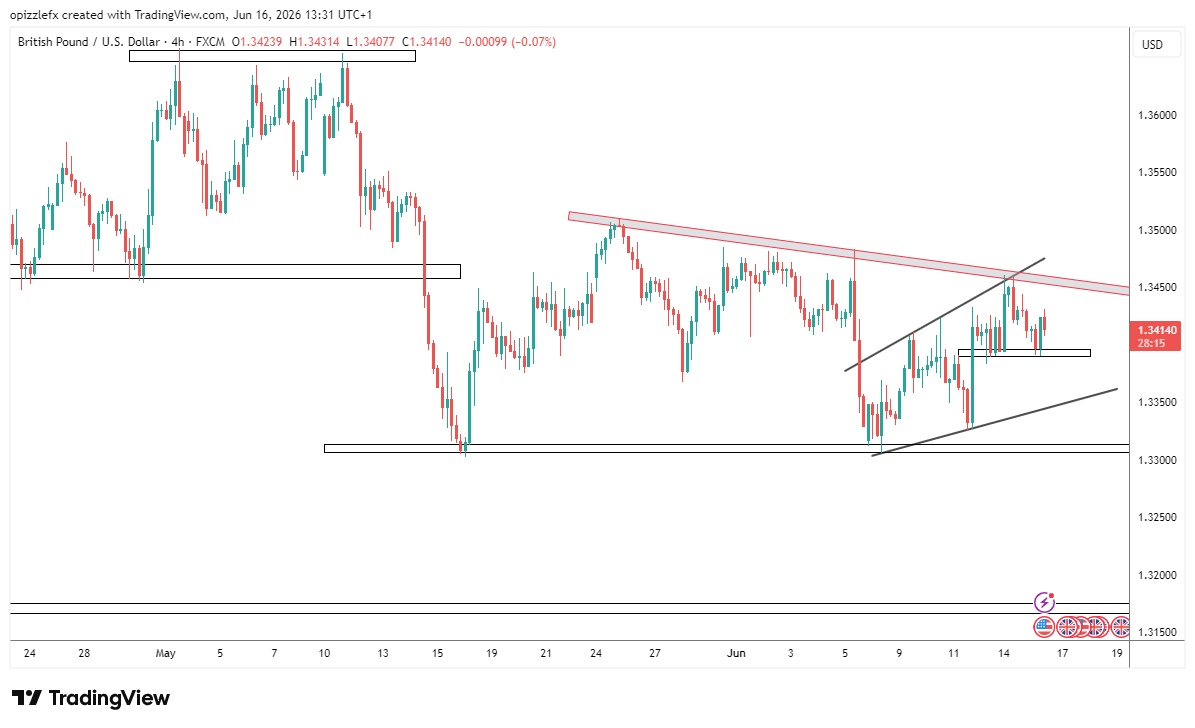
Price remains trapped between the descending daily resistance and the support structure around 1.3310. This compression phase is creating a tightening range where neither side has achieved a decisive breakout.
The market recently attempted to rally toward the upper boundary of the structure but was once again rejected before reaching a sustained breakout.
This repeated failure to create higher highs suggests that buyers are struggling to build momentum.
At the same time, support around 1.3310 continues to attract demand, preventing an immediate breakdown.
This creates a situation where traders should remain patient and allow the market to reveal its intentions through either a support breakdown or a bullish breakout above resistance.
1-Hour Timeframe Analysis: Short-Term Weakness Emerging
On the 1-hour chart, price action reveals signs of short-term weakness.
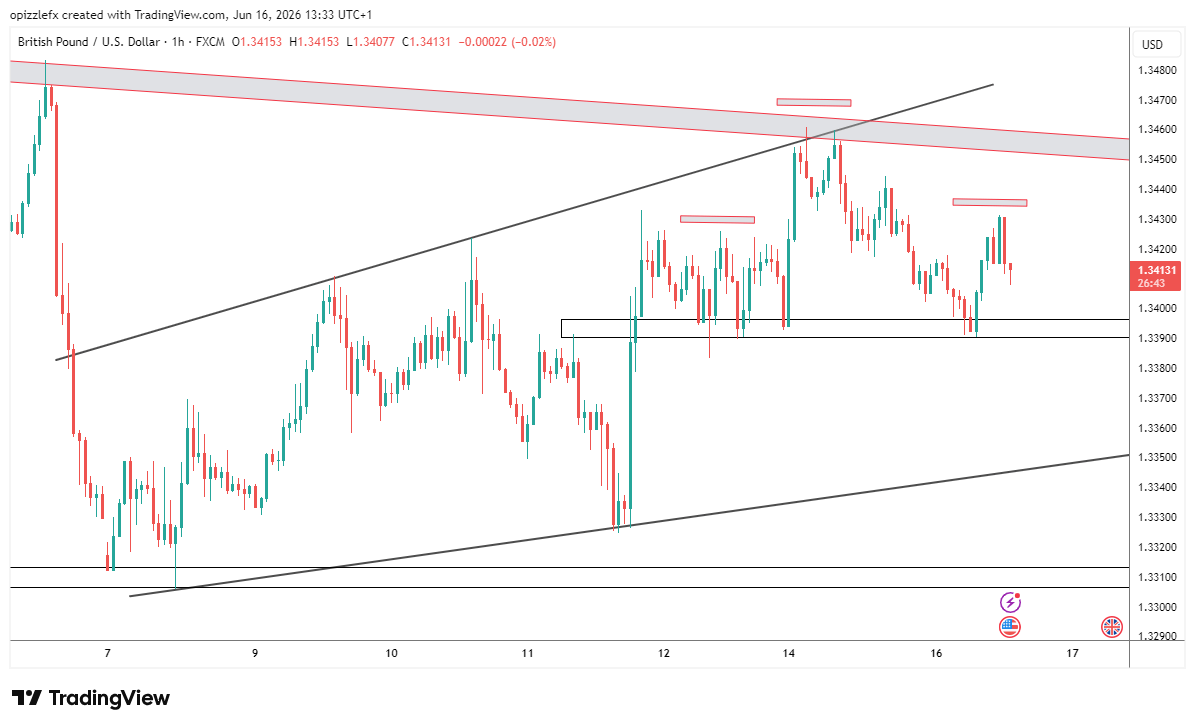
Several lower highs have formed beneath resistance, while bullish rallies have become increasingly limited. The market continues to respect the intraday resistance zones, indicating that sellers remain active whenever price attempts to move higher.
The inability of buyers to sustain momentum above recent swing highs further supports the bearish outlook coming from the higher timeframes.
Key Levels to Watch
Major Resistance
- Descending daily trendline resistance
- 1.3450 – 1.3470 region
Immediate Support
- 1.3310 support structure
Major Bearish Target
- 1.3200 psychological support zone
GBP/USD Directional Bias
Current Bias: Bearish
- Daily descending triangle remains active.
- Strong rejection occurred at daily trendline resistance.
- Buyers failed to maintain control after yesterday's rally.
- Lower highs continue to form across lower timeframes.
- The bearish correction structure remains intact.
As long as price remains below the descending resistance trendline, sellers maintain a technical advantage.
Trading Scenarios
Bearish Scenario
If GBP/USD breaks below the 1.3310 support level with strong momentum, sellers could gain further control of the market.
- 1.3270
- 1.3230
- 1.3200 major support zone
A decisive daily close below support would strengthen the bearish outlook significantly.
Bullish Scenario
For buyers to regain control, price would need to break above the descending resistance trendline and sustain trading above recent swing highs.
Such a move would invalidate part of the bearish structure and open the door for a deeper recovery.
What Beginner Traders Should Learn From This Setup
One of the biggest mistakes new traders make is focusing only on entries while ignoring the story that price action is telling.
- Buyers attempted to push the market higher.
- Sellers defended a major resistance level.
- Price produced a significant rejection.
- The market remains trapped within a bearish structure.
By understanding this sequence, traders can better align themselves with market momentum instead of fighting against it.
Final Outlook
GBP/USD remains under bearish pressure after rejecting a major daily resistance trendline. The descending triangle pattern continues to dominate the higher timeframe structure, while the support zone around 1.3310 remains the key level that traders should monitor.
A breakdown below support could accelerate selling pressure toward the 1.3200 region. Until buyers successfully break and hold above resistance, the path of least resistance remains tilted to the downside.


